Mars · Manufacturing
How we designed Breakdown Analysis, BPS, and FMOS for the Mars factories
We led product design on the internal tools Mars runs its European factories on, from September 2023 to June 2026: FMOS, the BPS problem-solving tool, and the move of Breakdown Analysis from Power Apps to Mendix. The product owner approved our Breakdown Analysis prototype for testing with the European sites. Breakdown Analysis is expected to save Mars at least €86 million a year. In 2026, we rebuilt the three products as one clickable coded prototype.
- Client
- Mars
- Sector
- Manufacturing
- Our work
- Product and interface design
01
About the project
We led product design for Mars from September 2023 to June 2026, on the Digital MAKE program for the European factories. We started next to the designer who was already on the program, and from early 2026 we were the only designers on these products. When the delivery partner changed, we ran the knowledge transfer to the new team's designer.
What it is: Mars runs its European factories on a set of internal tools built in Mendix. FMOS, the Factory Mars Operating System, is the central one. Shift teams log their KPIs, downtime, and safety checks in it. BPS is the problem-solving tool: a deviation from a KPI gets actions, and if the team can't solve it at their level, it's escalated up the CP levels. Breakdown Analysis is the tool reliability engineers use to find the root cause of a machine breakdown. In 2025, it was still a Power Apps app, and Mars decided to rebuild it in Mendix next to BPS.
Outcome: We designed screens across FMOS, BPS, and Breakdown Analysis, and we built an interactive Breakdown Analysis prototype that the product owner approved for testing with the European sites from January 2026. In 2026, we went back to the original screens and rebuilt the three products as one clickable coded prototype.
02
Prototype
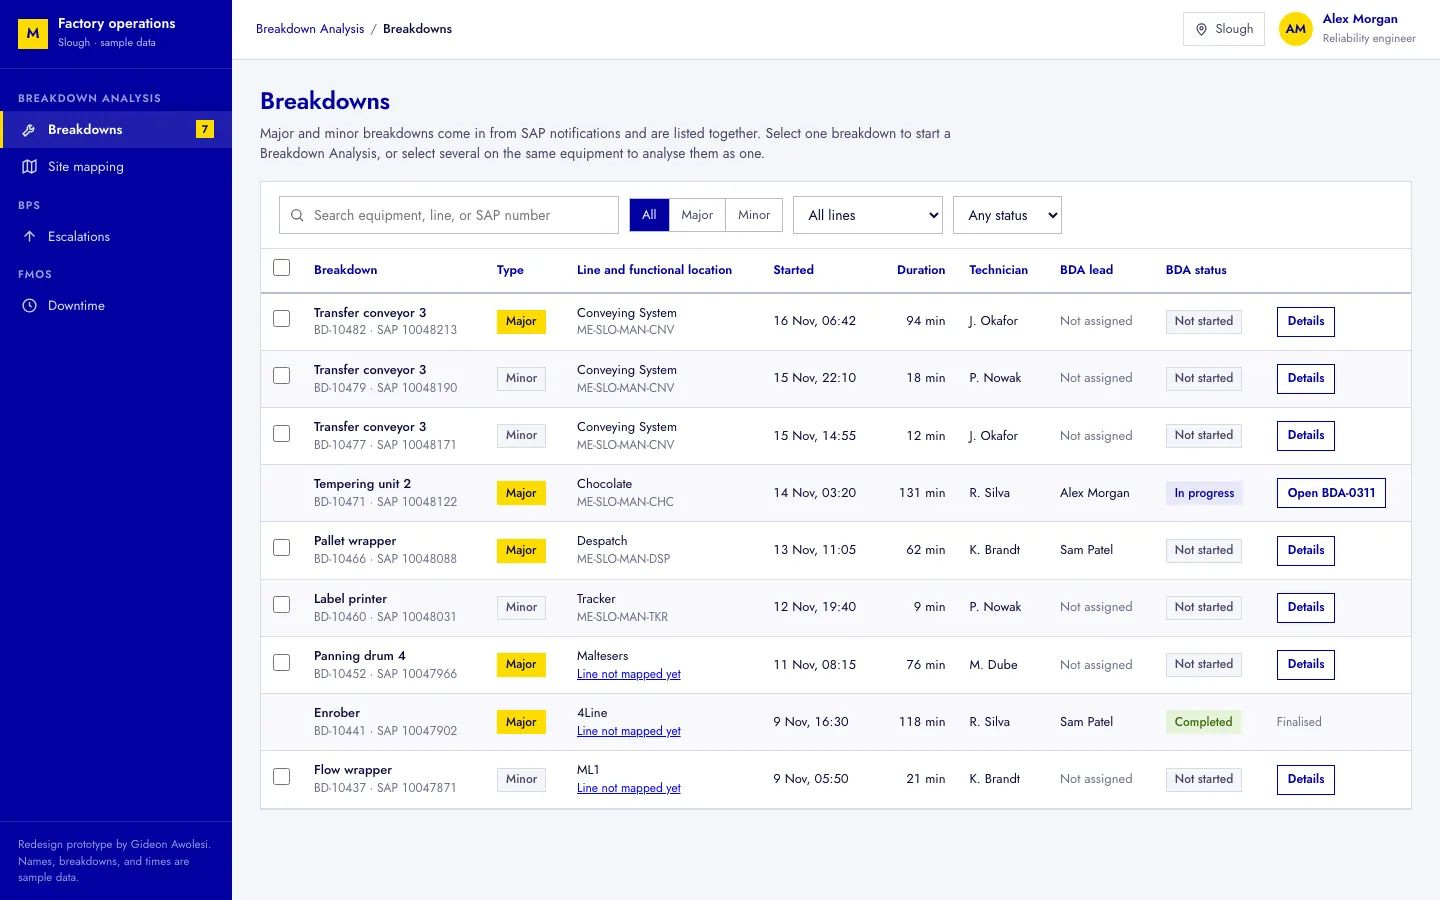
Interactive prototype: You can go through a Breakdown Analysis from the breakdown list to the finalised root cause, edit the site mapping, decide on a BPS escalation, and log a shift in Downtime.
Try this: In Breakdowns, select the three Transfer conveyor 3 breakdowns and press Combine and start BDA. Fill in BD page 1, then ask why until you reach the root cause, confirm it, and add a corrective action as an SAP action. After that, open Downtime and add an unplanned event under the slow running row to explain the last 8 minutes of speed loss.
03
How Breakdown Analysis works
When a machine breaks down, the maintenance technician reports it in SAP as a notification, and it comes into Breakdown Analysis as a major or a minor breakdown. A reliability engineer, the BDA lead, decides which breakdowns need an analysis. Some breakdowns on the same equipment belong together, so the lead can combine them into one analysis.
The analysis has five steps. On BD page 1, the team reviews each breakdown and writes the problem statement as a 5W2H: what happened, where, when, who found it, why it's a problem, how it happened, and how much it cost. In the 5 Why analysis, they start from the problem and ask why, and each answer becomes the next question. Every why can have actions, which are checks to prove or disprove that answer, and the team confirms the why that turns out to be the root cause.
Corrective actions are then added only to the confirmed root causes. A corrective action can be created as an SAP action, and then it needs a planner group, so that SAP can create the work order. In the systems analysis, the team answers a set of standard questions and a set of site-specific questions about the maintenance system around the breakdown. The last step is to check everything and finalise the analysis.
Two rules make it different from BPS. In BPS, the team starts from the root cause and works through the whys. In Breakdown Analysis, they start from the problem. Also, actions in Breakdown Analysis can't be rejected, because each one is a check that comes back with findings, not a yes or no.
The admin pages hold the setup each site needs: user management, site mapping, trigger points, the notification mailing list, site-specific questions, SAP questions, and the action column list. Site mapping is the one that connects SAP to the lines. Each line in a value stream is mapped to its SAP functional locations, and a breakdown reported on a functional location finds its line through that mapping.
04
The product problem
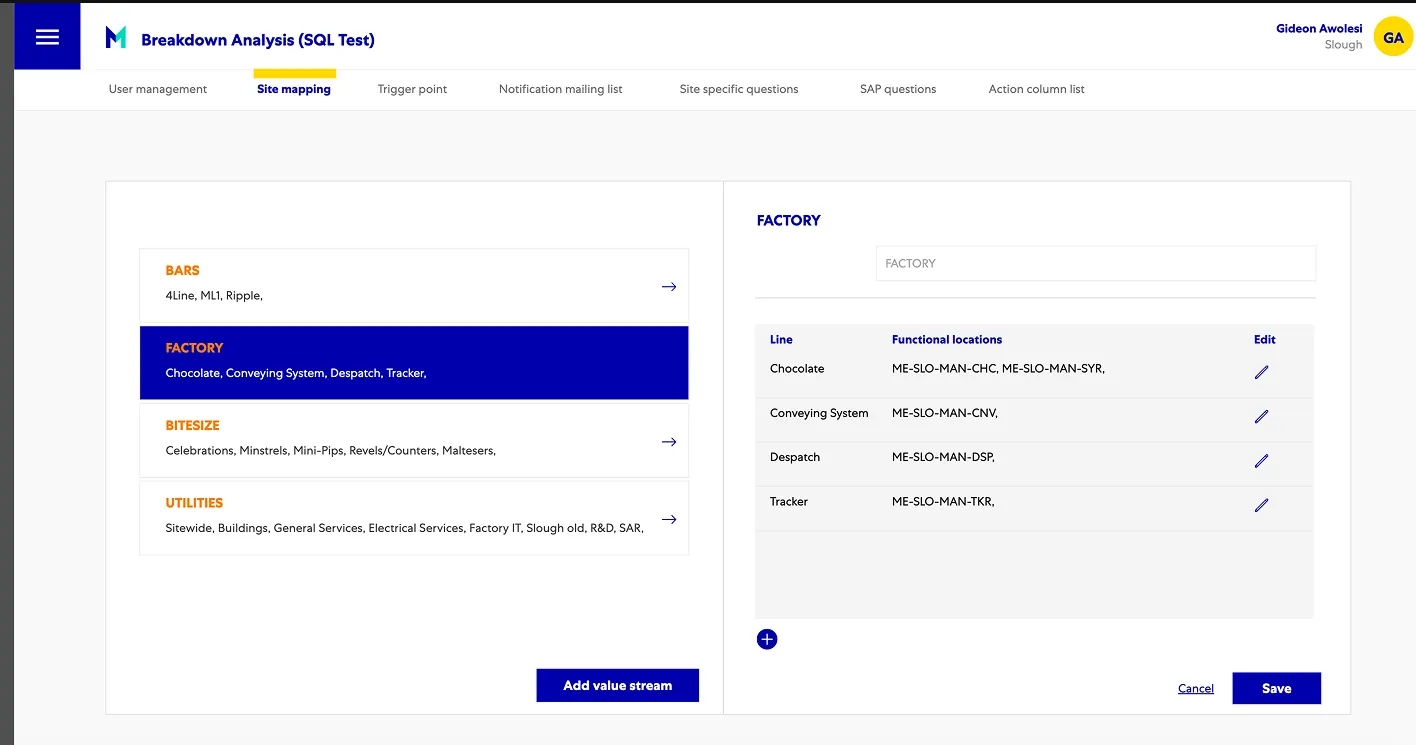
Breakdown Analysis in Power Apps had three limits the team kept running into. It didn't store enough history, it didn't update in real time, and it could only reach SAP through the data lake. Major and minor breakdowns were in separate places, and moving a minor breakdown into an analysis caused database issues. Technicians had also asked to fill in BD page 1 before the end of their shift.
There was a deadline on top of that. The product owner was retiring in May 2026, the team needed his knowledge of the BDA process in the new tool before then, and the target for the new tool was Q2 2026. Mars has more than 30 factories, so the product owner picked key users from the well-performing ones, and each key user collected feedback from their own team.
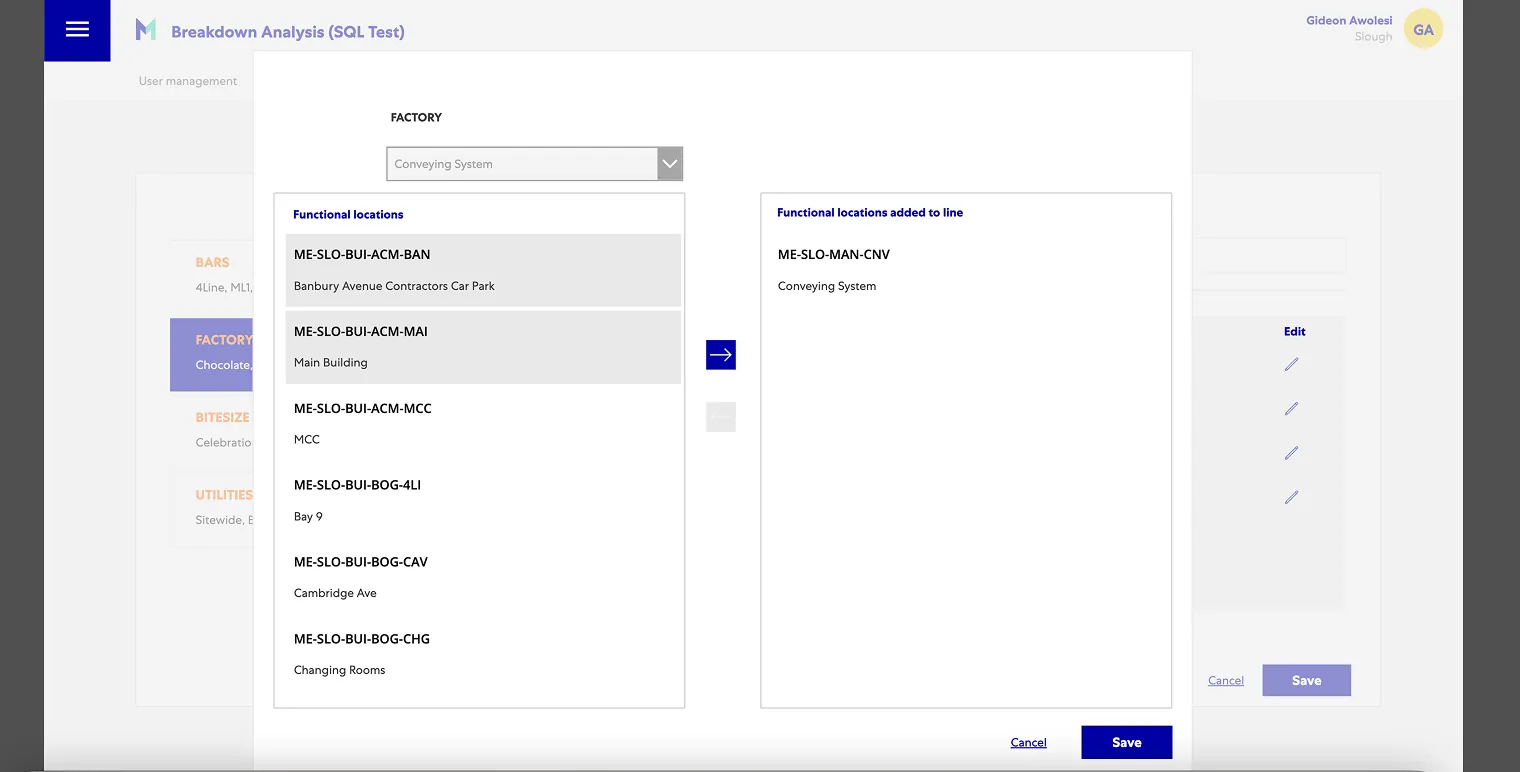
Site mapping in Power Apps worked through a modal. To map a location, you selected a value stream, pressed the pencil on a line, picked locations in the left list of a dual list, moved them across with an arrow, saved the modal, and then saved the page. The brief for the redesign was to reduce the number of clicks and make the page easier to work with.
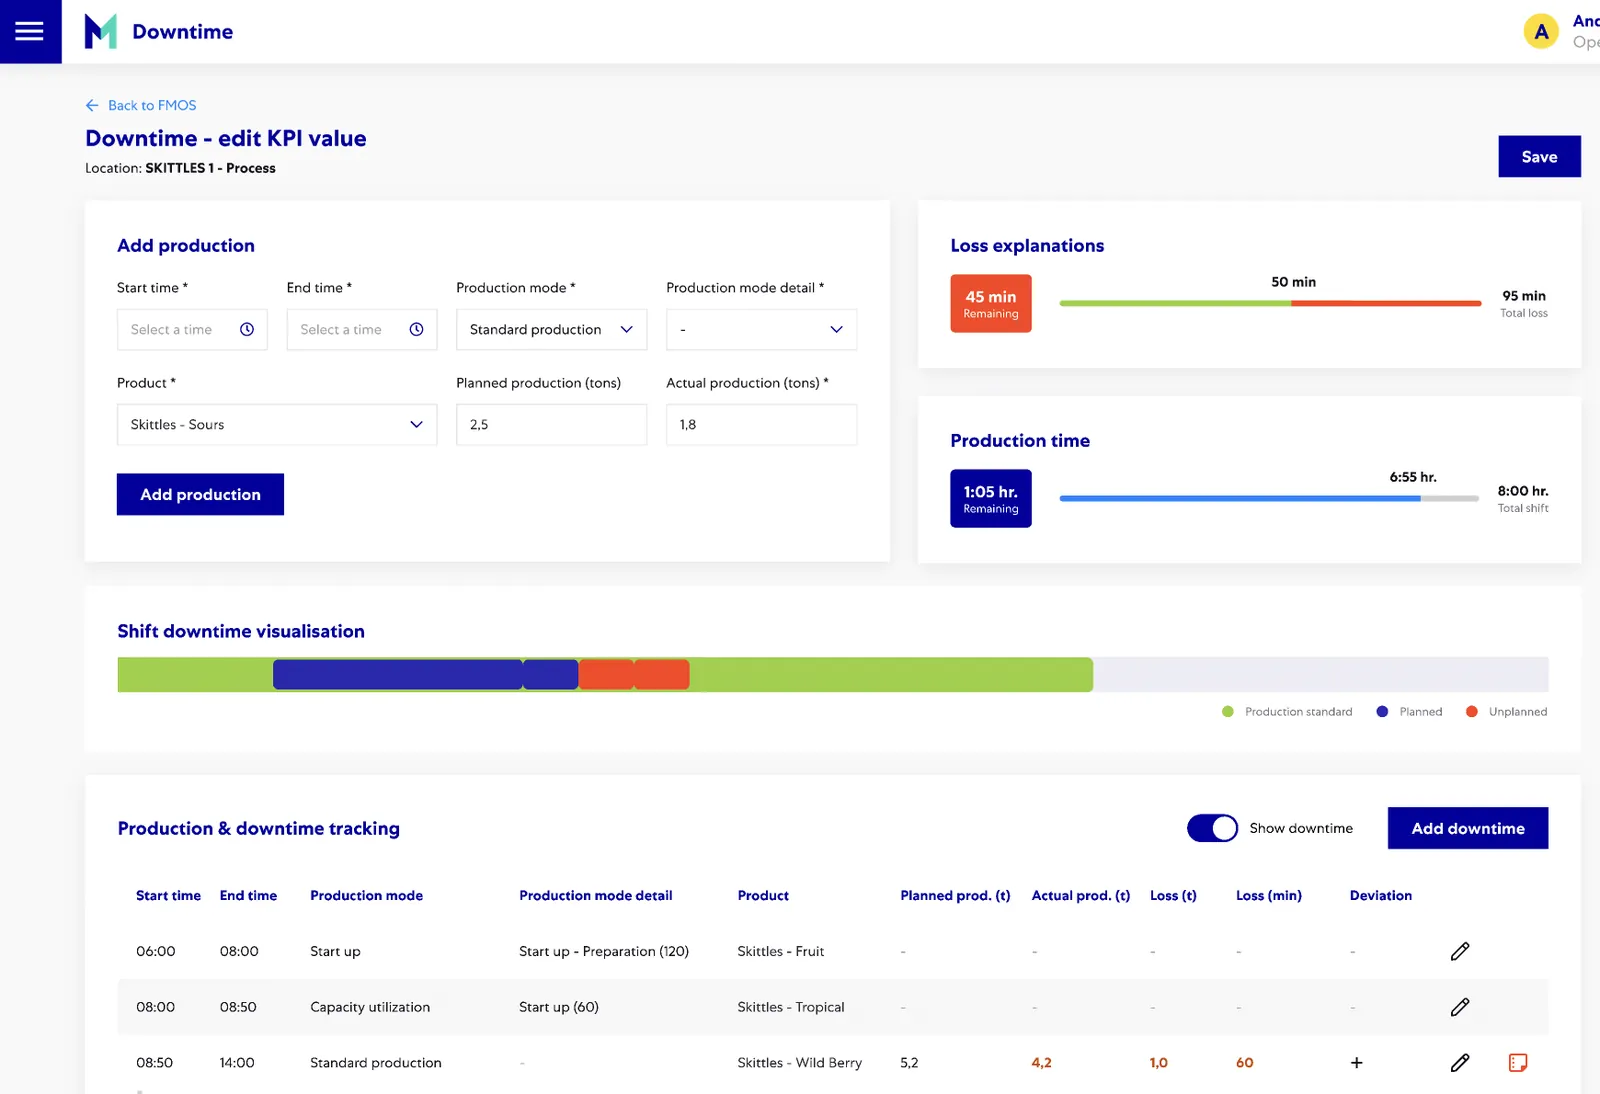
In FMOS, the Downtime app measured production in tons. Operators logged planned and actual tons for each event and explained the loss. Some factories can't forecast in tons, though. They measure line speed in cuts per minute, so they needed a second mode.
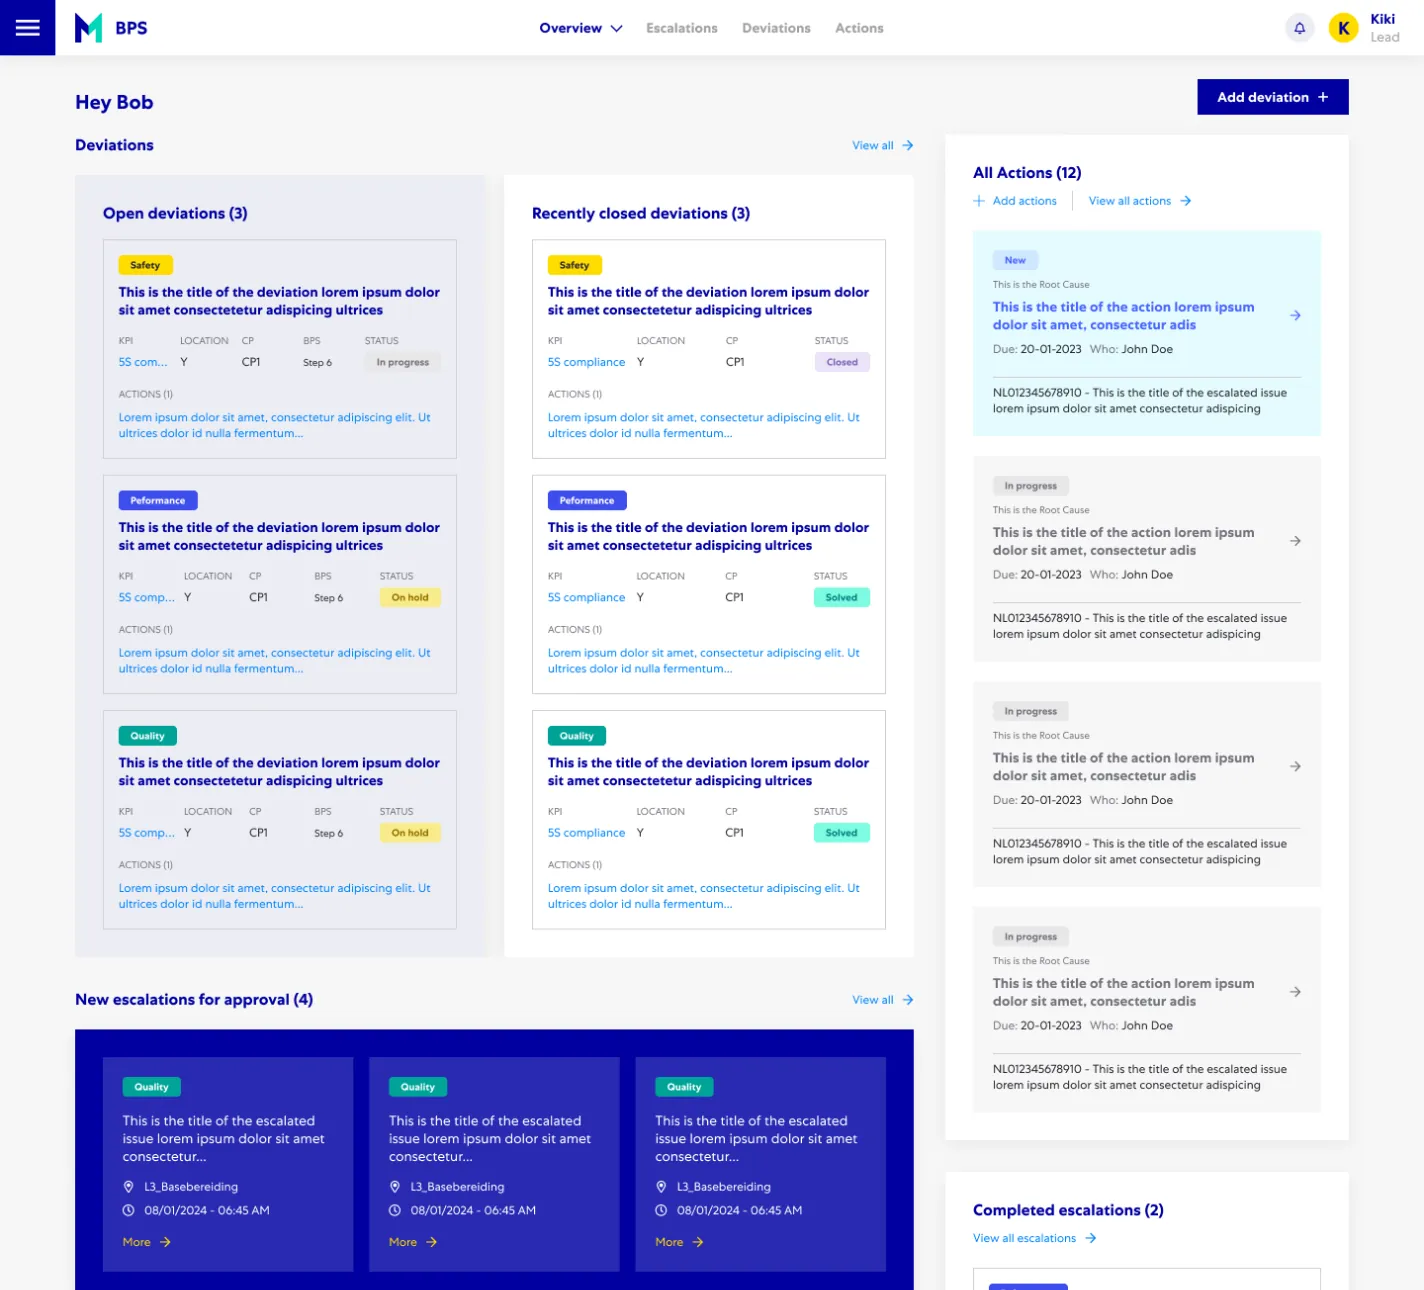
The BPS screens came from a previous agency, and their components were locked in that agency's Figma files. We couldn't edit the main components, so every fix meant rebuilding the component in the Mars design system first.
05
What we designed
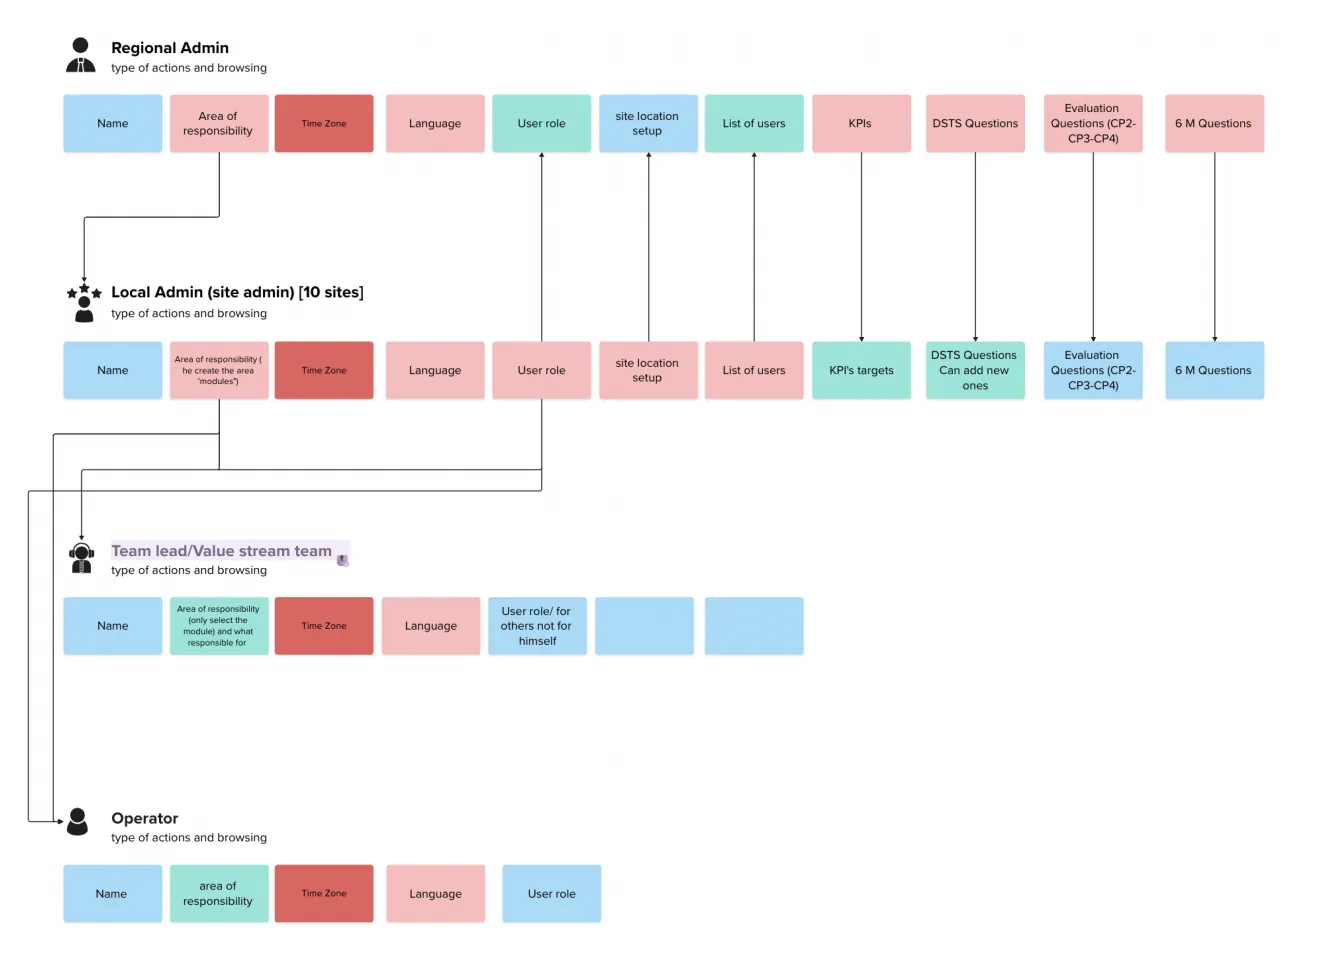
FMOS admin pages: The first project was the admin and personal pages for four roles: operator, team lead, local admin, and regional admin. We mapped what each role can see and edit, from the name and area of responsibility down to KPI targets and the DSTS, evaluation, and 6M questions. A local admin manages up to 10 sites and can edit KPI targets but can't create KPIs. Local admins can translate the evaluation and 6M questions that the regional admin writes, and we agreed with the team to tag new questions so people notice them.
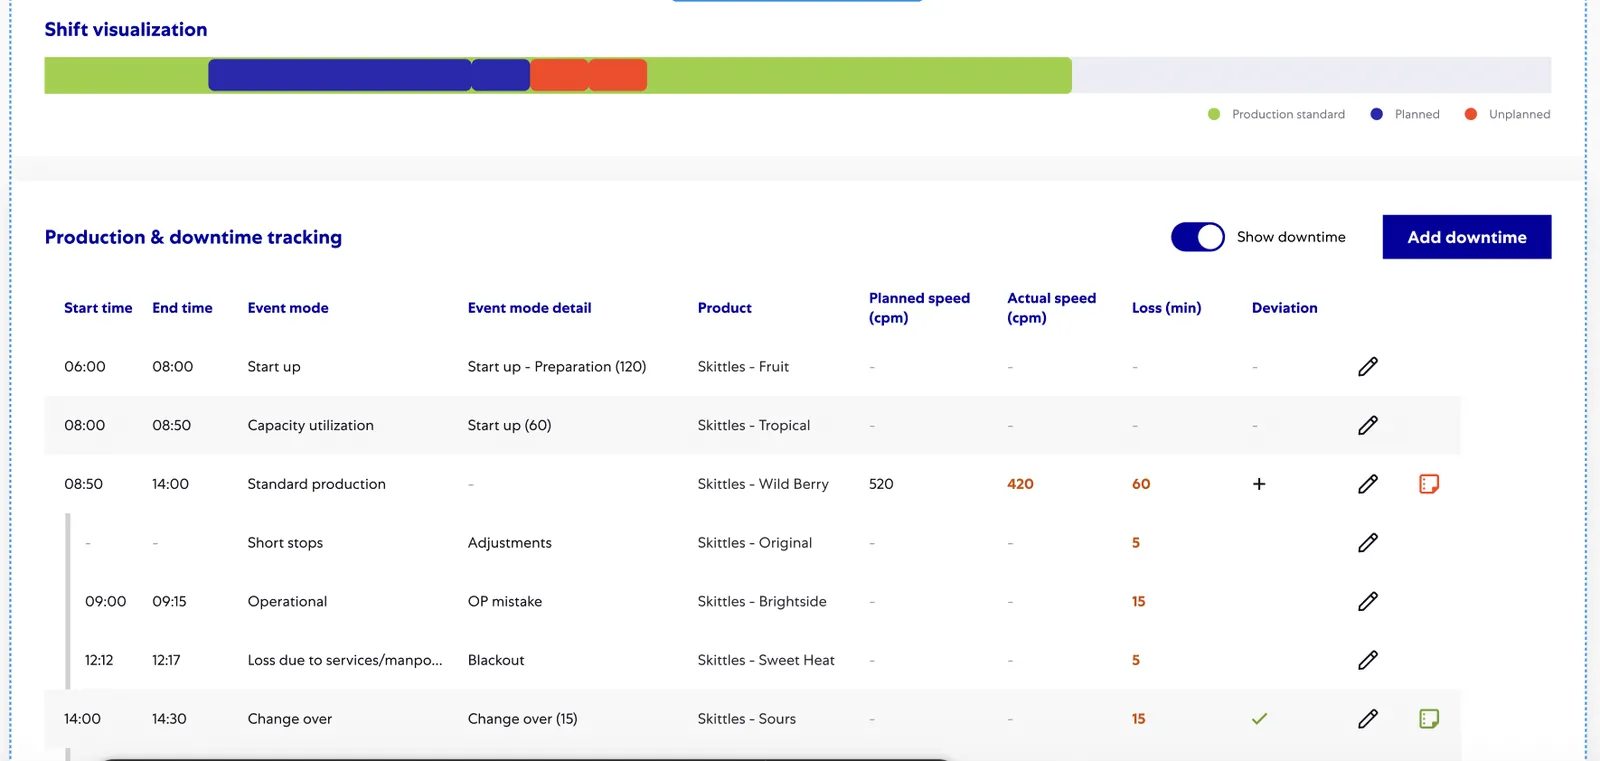
Downtime in speed mode: We designed the second mode, where the site admin chooses tons or speed for each factory. Planned and actual production in tons became planned and actual speed in cpm. Within Mars, downtime is one specific KPI, while cleaning and maintenance count towards other KPIs, so Add downtime became Add unplanned event, and Add production became Add event. The summary went to minutes only, without tons or currency. Operators fill in speeds only for slow running, unplanned events got a location, and for unplanned events Loss (min) always equals the event's duration.
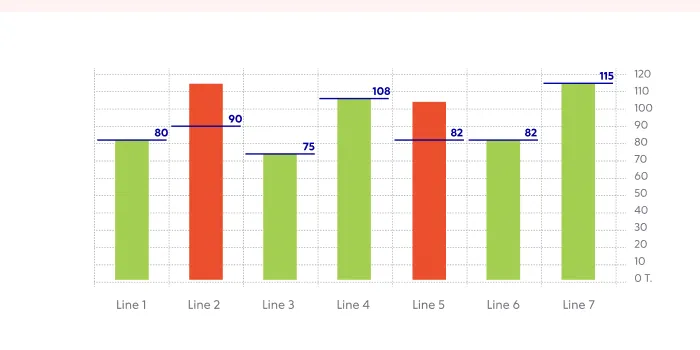
CP graph labels: The KPI names on the CP graphs are standardised and long, and they can't be renamed. We designed short codes for the axis, with the full name in a legend and on hover.
BPS: We designed the Game Plan screens for CP1, CP2, and CP3, and we redesigned the escalation overview to match the live implementation, with ongoing and completed actions and a switch between my actions and all actions. In 2026, we designed the CP1 rejection flow and the shiftboard updates.
Breakdown Analysis in Mendix: From October 2025, we designed the new tool in weekly sessions with the product owner and key users. The breakdown list has major and minor breakdowns together, and you can combine several breakdowns and work through each one without going back to the list. The 5 Why analysis has more room for the answers, an action panel at the side, and several actions for each why. The product owner chose a side navigation over a top header, because the header took too much vertical space, and the dashboard's three panels had to fit on a standard laptop screen without scrolling. A developer reviewed the designs against BPS and the design system and confirmed they could be built.
Interactive prototype: In December 2025, we built the Breakdown Analysis flow as an interactive prototype with AI coding agents. It took 172 iterations, from the breakdown list to the check and finalise step. The product owner approved it for testing with the European sites from January 2026, and we designed the admin pages next.
Design system: Because the old components were locked, we rebuilt them in the Mars design system. The stepper now has filled, error, and progress states, and the step manager has variants for up to 12 steps. We designed the chart legend for the style guide, we recommended darker table lines so rows are easier to follow, and we kept the straight corners that the product owner asked for as part of the Mars look.
One-pagers: For Digital MAKE, we designed the one-pager for line speed optimisation, an A1 poster for operators on the line, and the summary for Seamless Scheduling. After August 2025, the other designer on the program took over the one-pagers, and we focused on FMOS and BPS.
06
How we worked with the team
We joined the daily stand-ups with the developers, testers, the scrum master, and the product owners, and we picked up design requests from them directly. Breakdown Analysis had its own weekly meeting with the product owner and the reliability engineers, and we reviewed every flow with them screen by screen, starting from the first screen after sign-in.
A lot of the design decisions came from those calls. A BDA lead asked to see who's assigned to each analysis, so the breakdown list has a BDA lead column. One of the key users explained that they almost never reject a breakdown one by one, so rejecting is a secondary action. On the Downtime app, the stakeholders asked for the two modes to look different in Figma, and for operators to fill in speeds only when the line is slow running.
Access was the slowest part. It took two weeks to get Figma working on the Mars systems, and the agency components stayed locked, so we recreated the base components we needed. When the delivery partner changed in 2026, we cleaned up the FMOS designs in Figma and ran the knowledge transfer to the new designer.
07
How we redesigned it
In 2026, we rebuilt Breakdown Analysis, the site mapping, a BPS escalation, and Downtime as one coded prototype. We kept the Mars look: deep blue, yellow for the current item, straight corners, and the real Slough value streams, lines, and functional location codes. Jost replaces the Mars typeface, because it's free to use on the web. The breakdowns, people, and times are sample data.
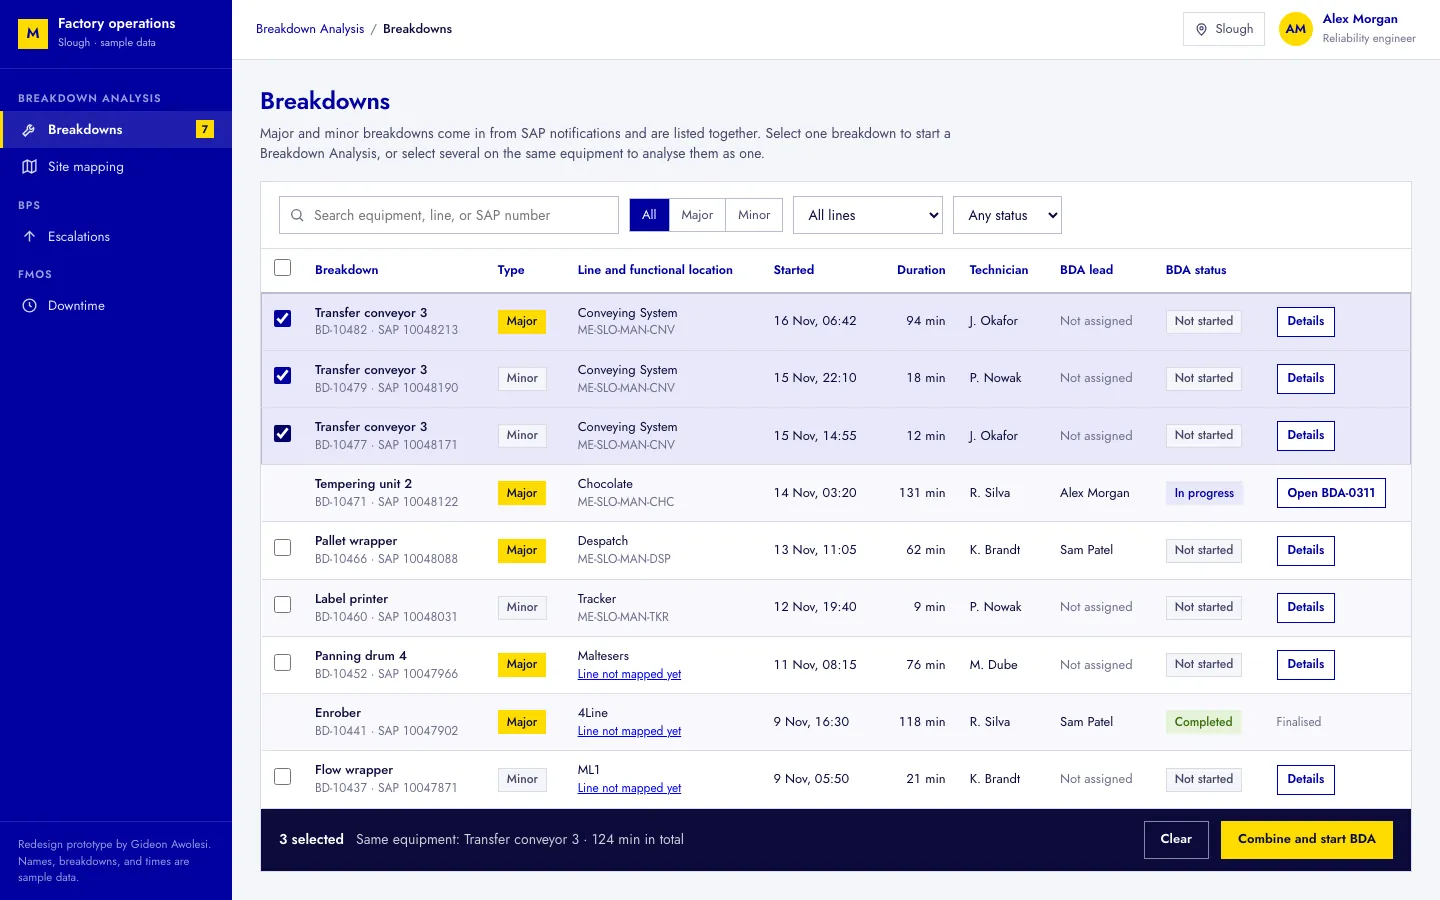
Breakdown list: Major and minor breakdowns are in one table with a BDA lead column. When you select breakdowns, a bar at the bottom has the equipment and the total minutes, so you can check that they belong together before you combine them. If a breakdown's line isn't mapped yet, the row links straight to that line in site mapping.
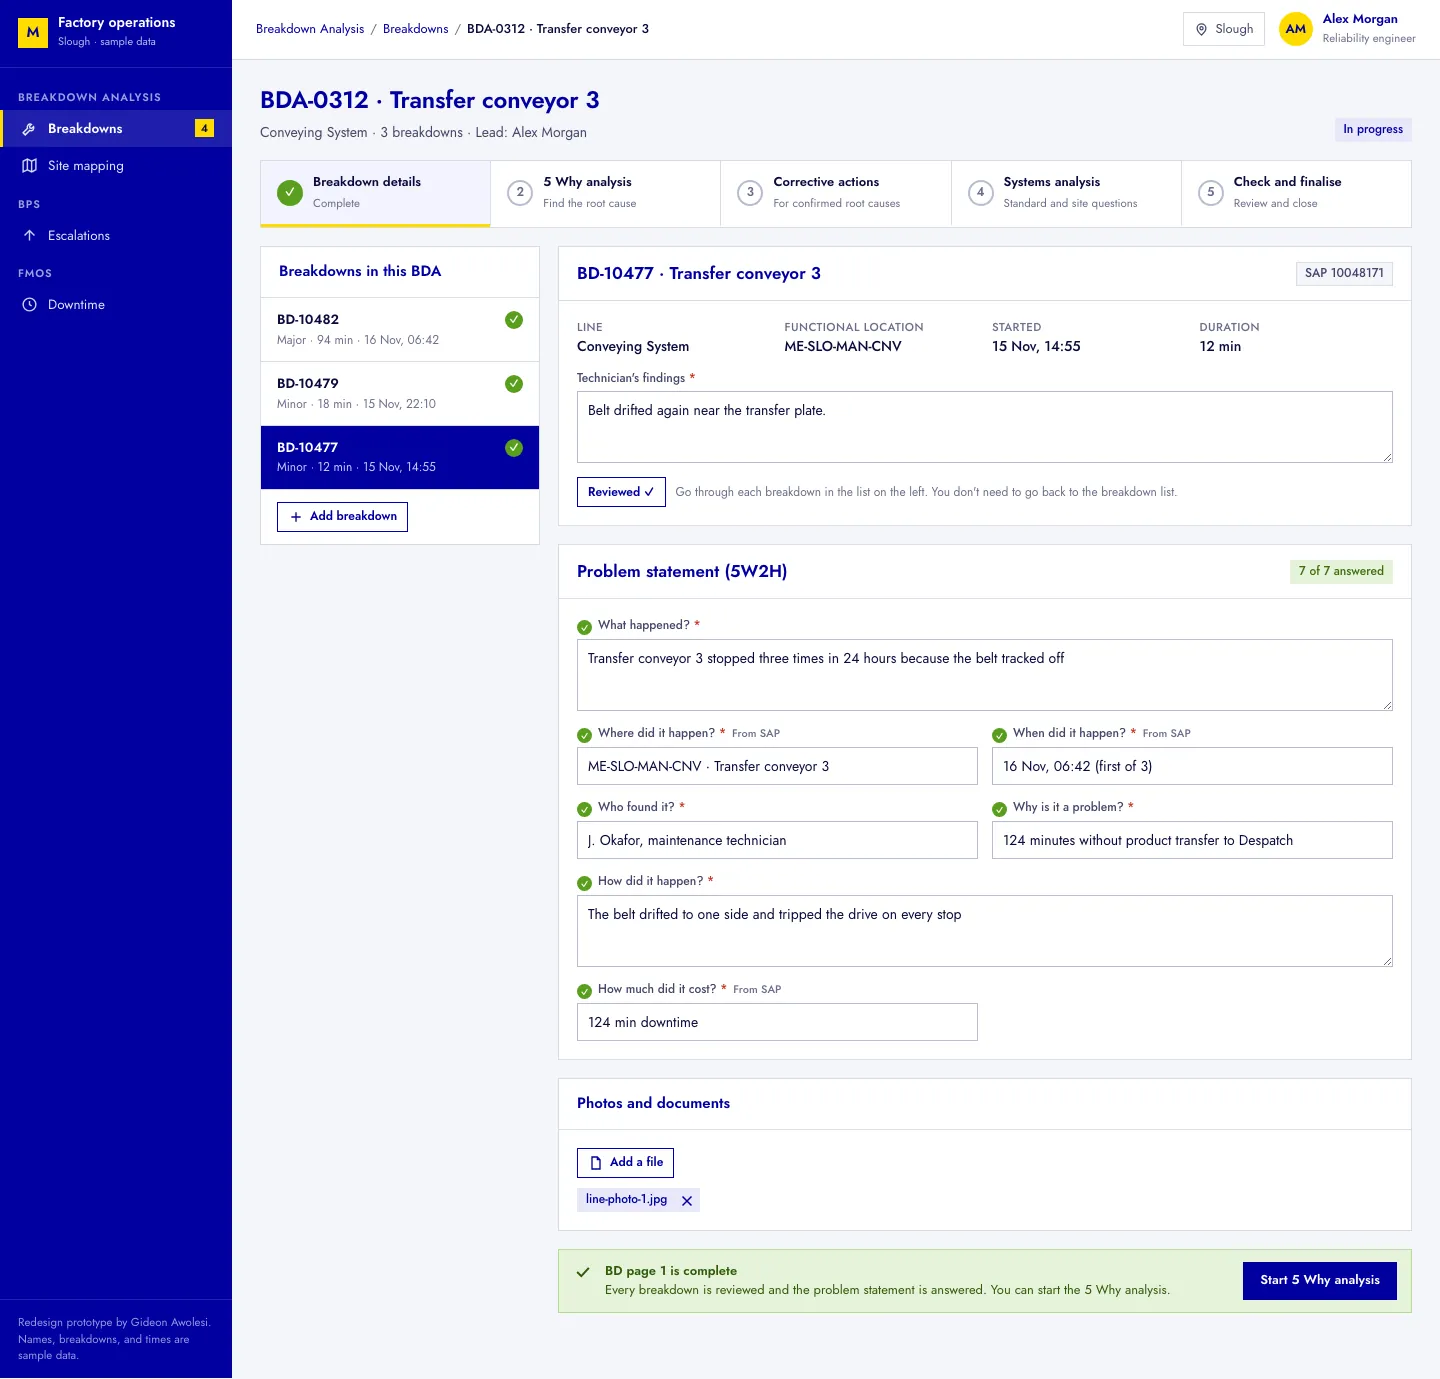
BD page 1: The combined breakdowns are in a list on the left, and each one gets a red mark until its findings are in and it's reviewed. The 5W2H marks each answer the same way, and Where, When, and How much come pre-filled from the SAP notification. When everything is answered, a green banner reads BD page 1 is complete, with a button to start the 5 Why analysis.
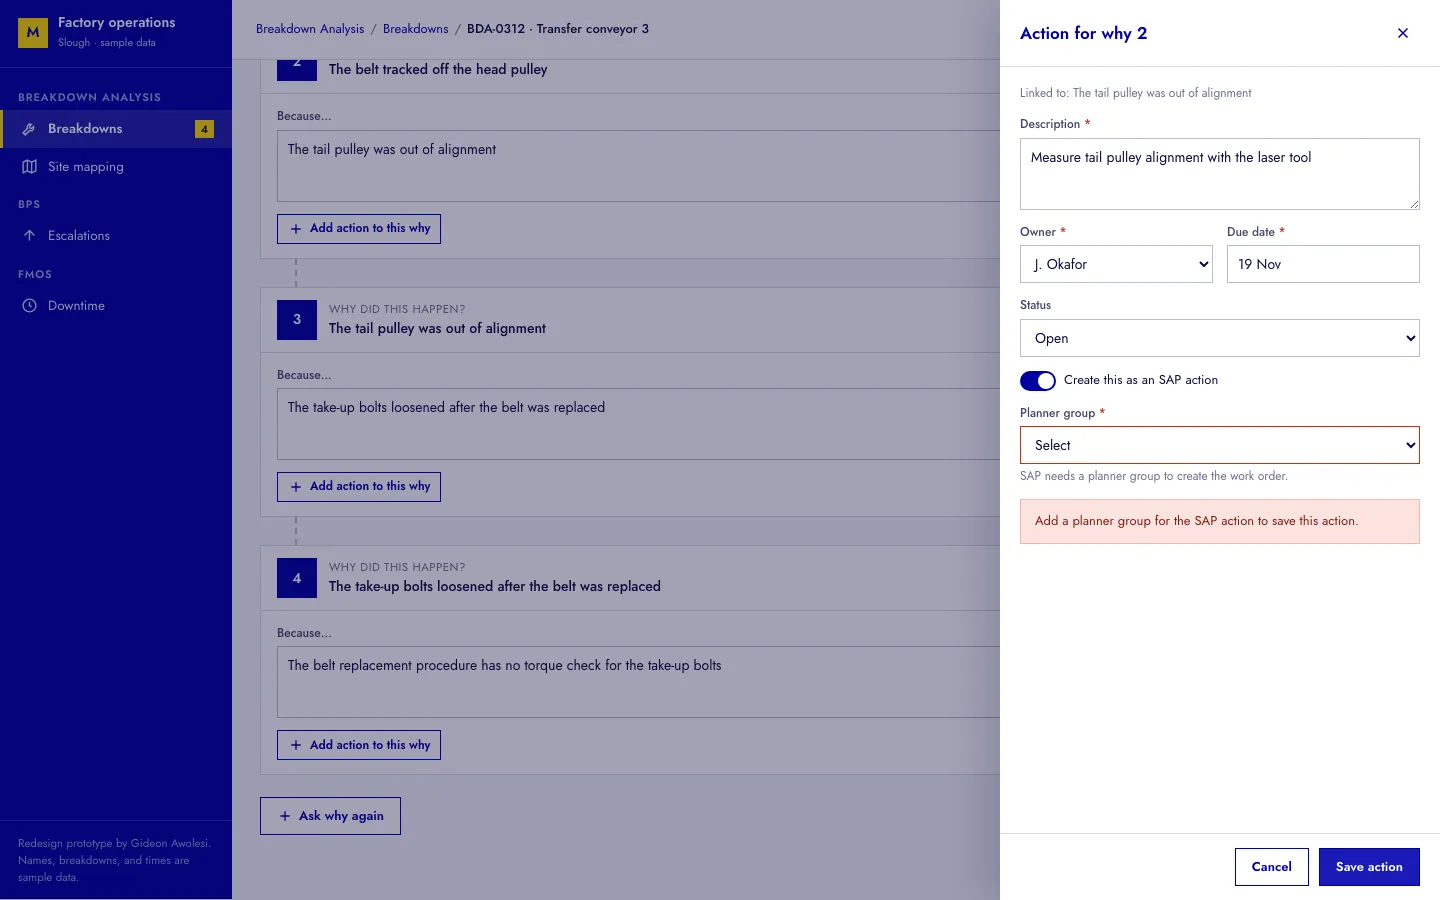
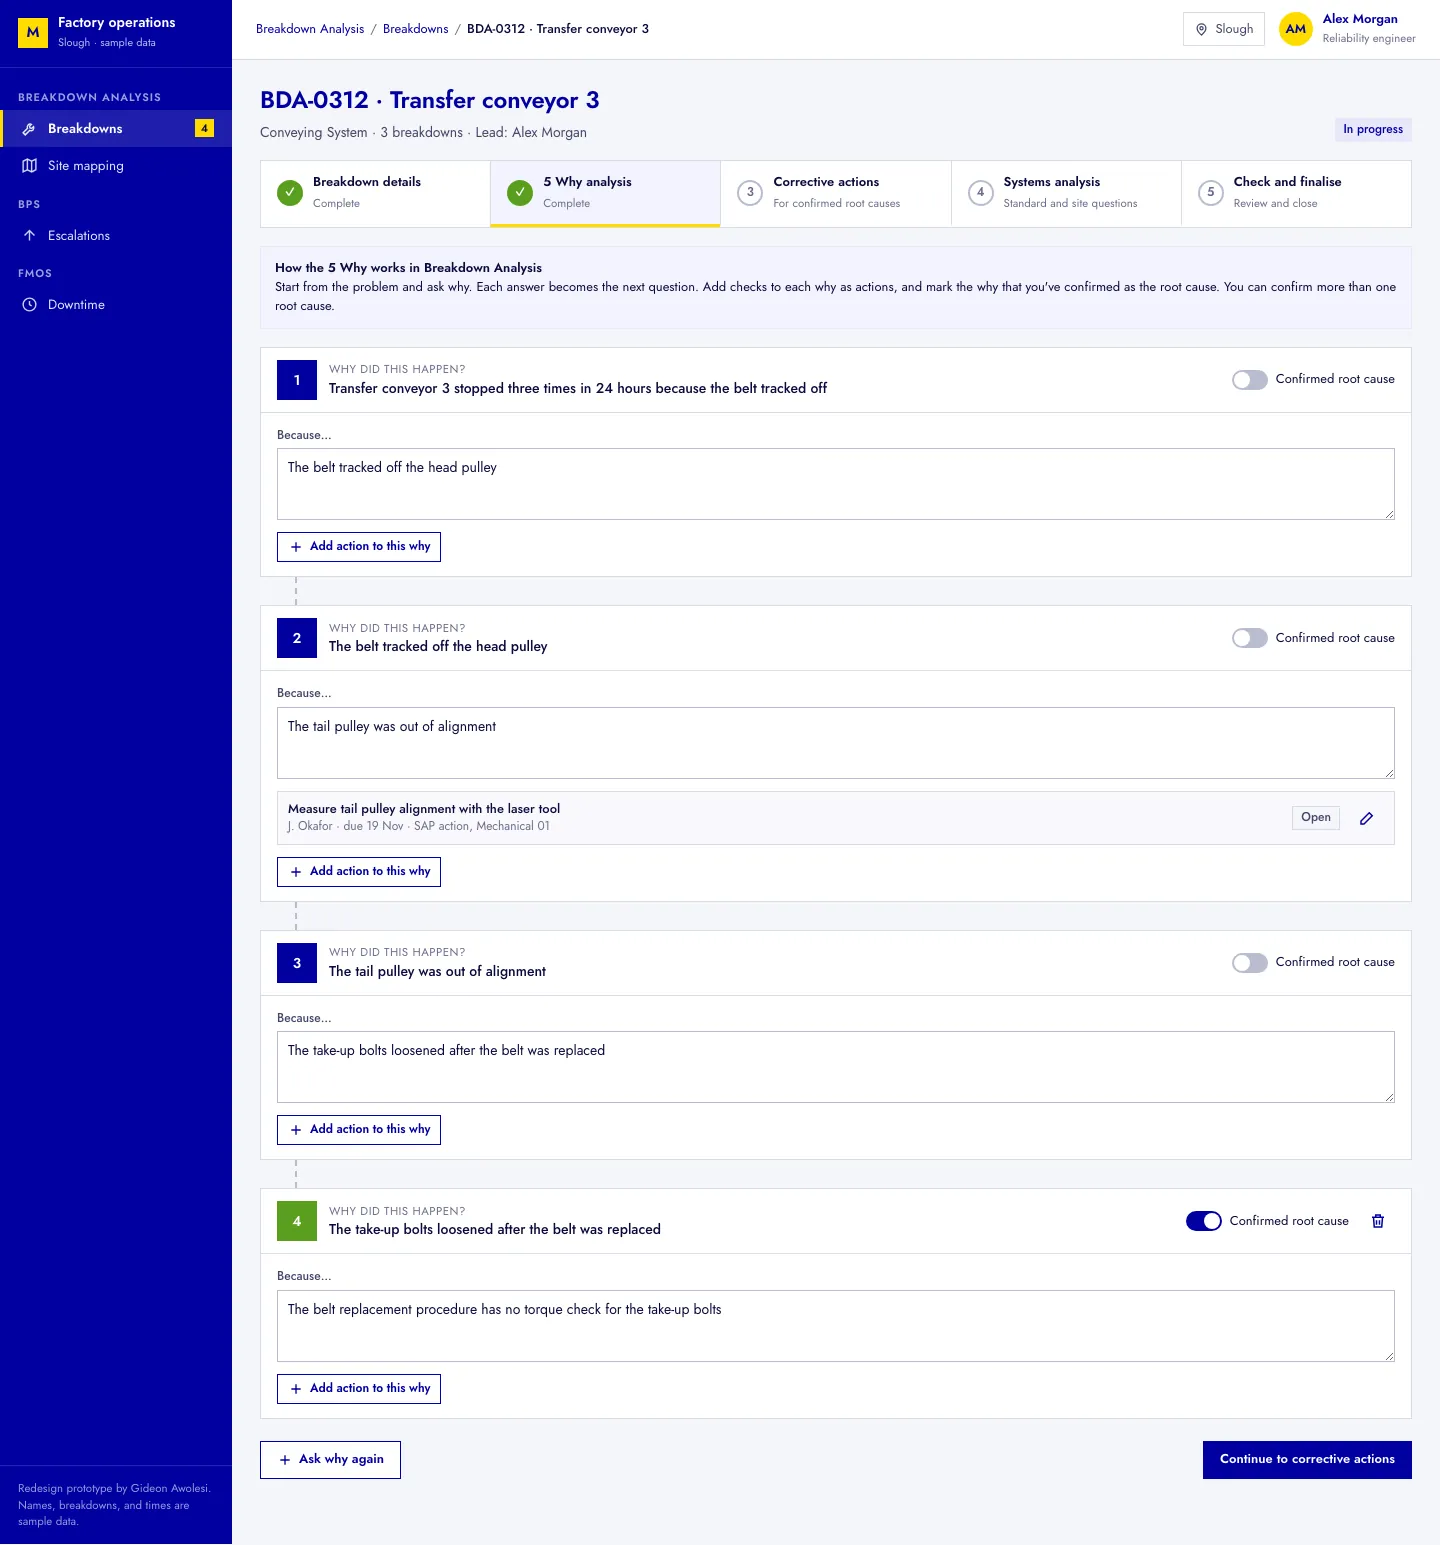
5 Why analysis: The previous answer is the question at the top of each why, so you read the chain from the problem down to the root cause. Actions open in a side drawer, and if you make one an SAP action, the drawer won't save it until you choose a planner group. You can confirm more than one root cause.
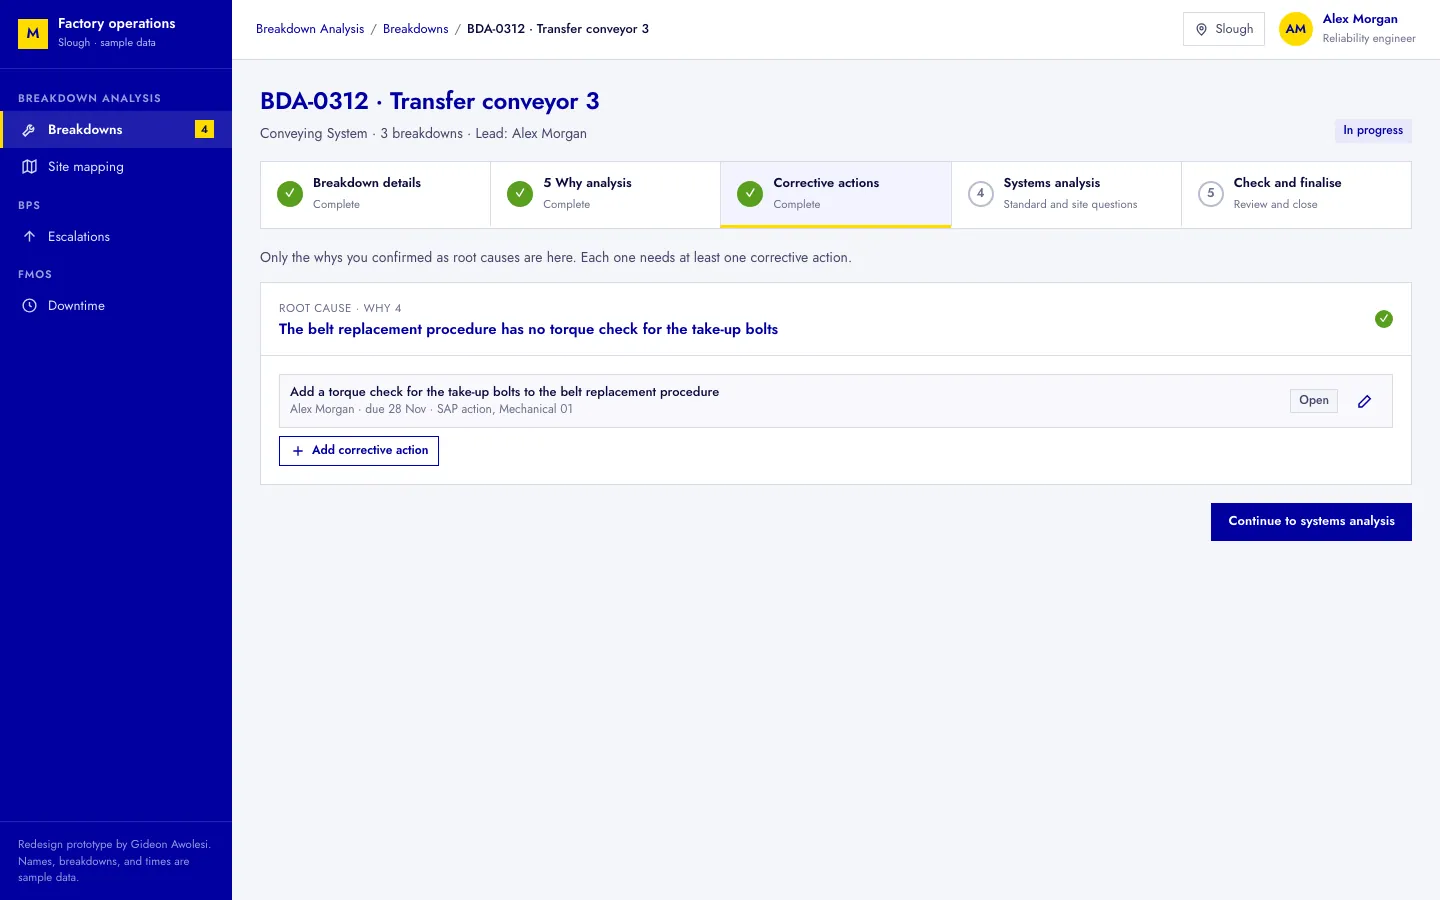
Corrective actions and systems analysis: Only the confirmed root causes appear as cards, and each card needs at least one corrective action. The systems analysis has the standard and site-specific questions in two tabs, each with a count of the answered questions. If you answer No, you add what was missing.
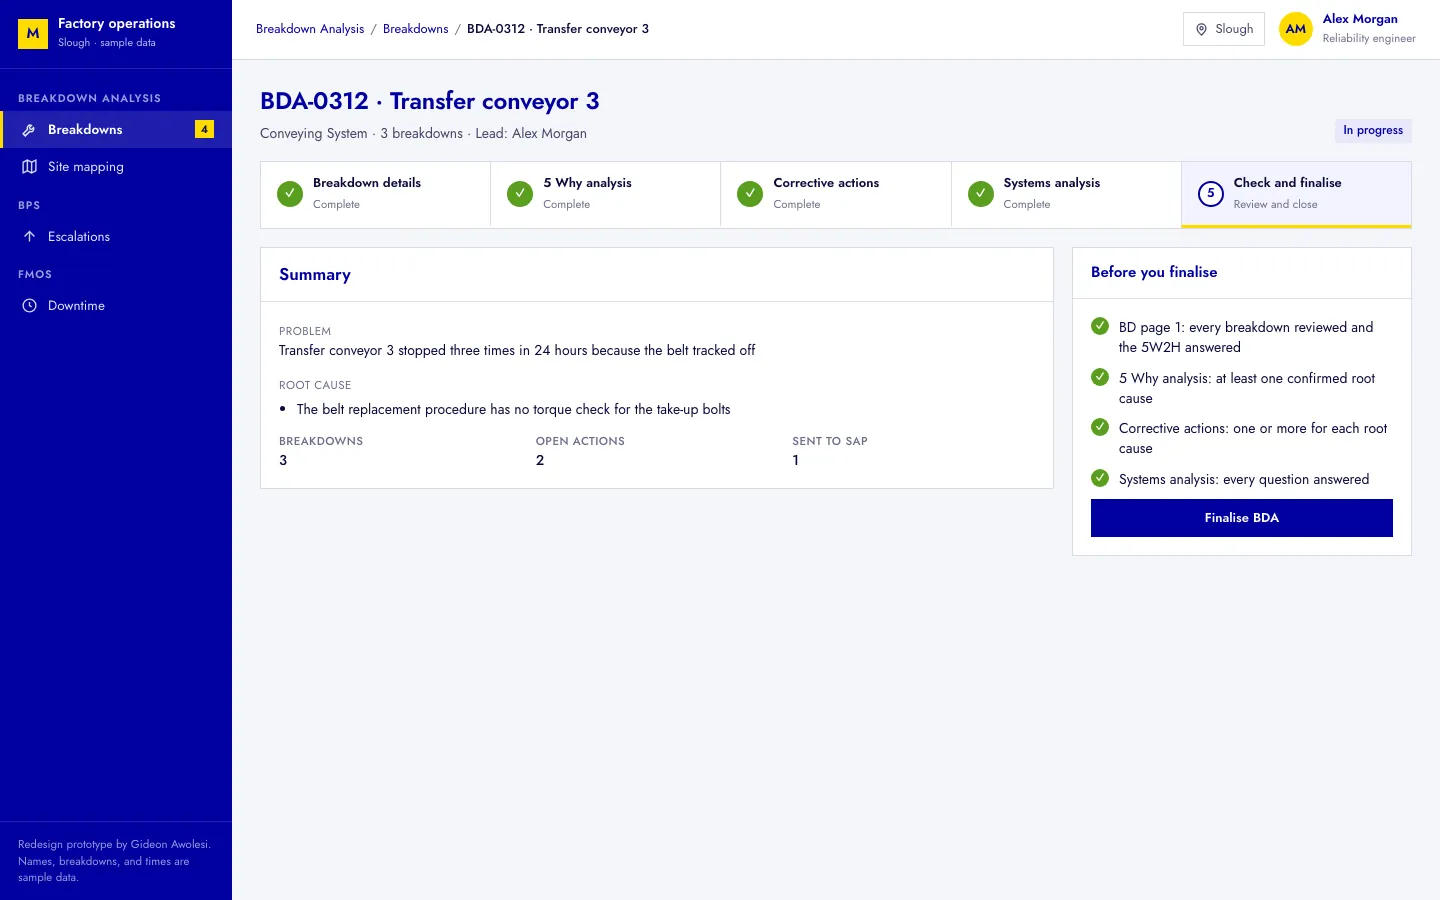
Check and finalise: A checklist lists what's still missing in each step, with a link back to that step, and Finalise BDA stays disabled until the checklist is complete. Rejecting a breakdown needs a reason, and the breakdown list keeps it.
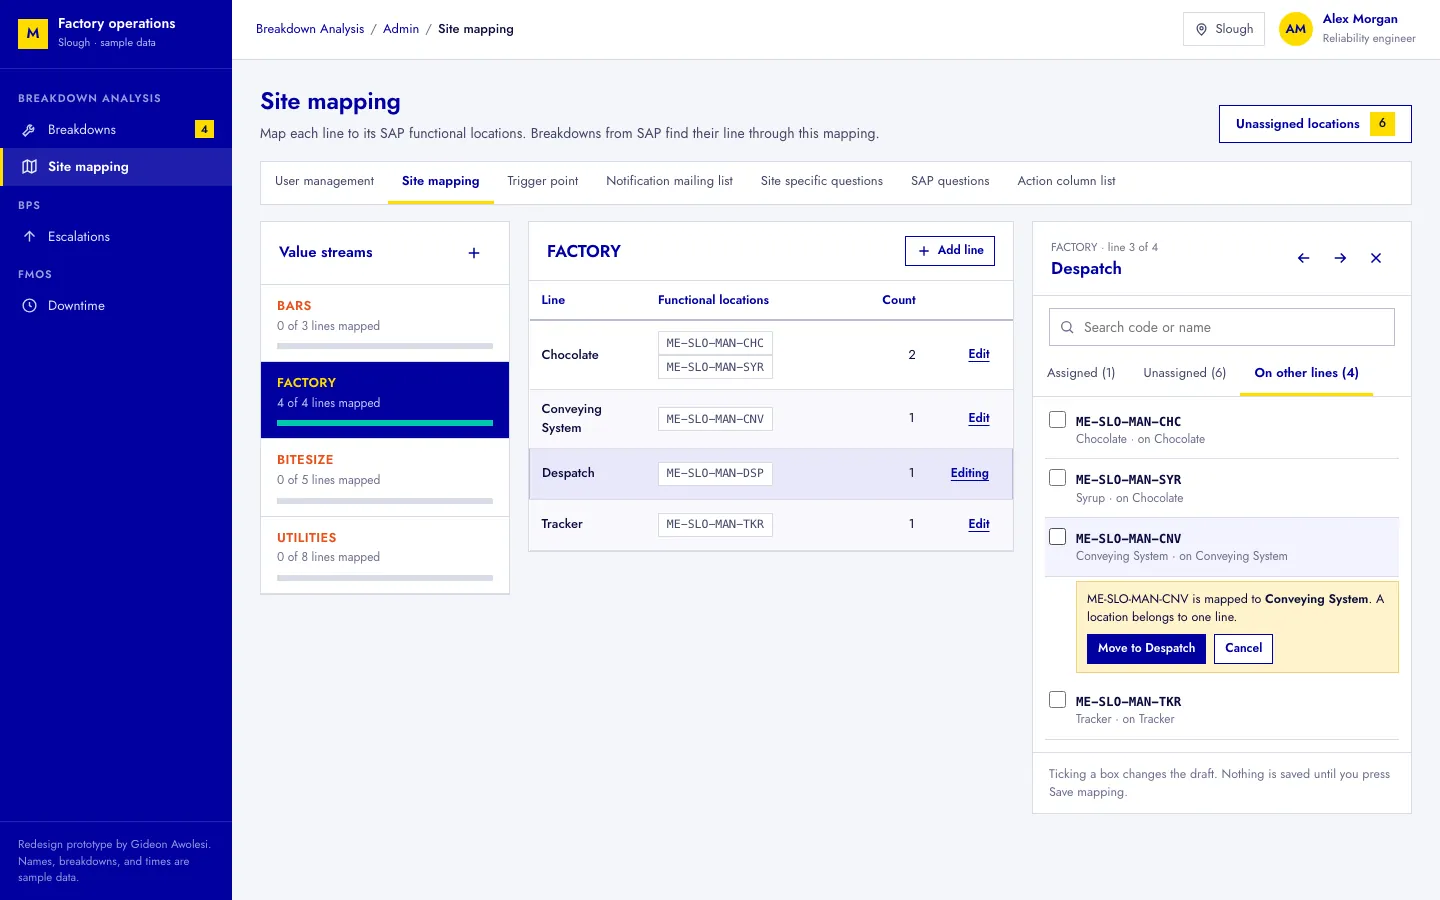
Site mapping: Everything is on one page, without a modal. You click a line, and an inspector opens on the right with a search and three tabs: assigned, unassigned, and on other lines. Ticking a box maps the location. If it's already on another line, you choose to move it or cancel, because a location belongs to one line. Changes stay in a draft with Undo until you save, and the arrows move to the next line in the value stream.
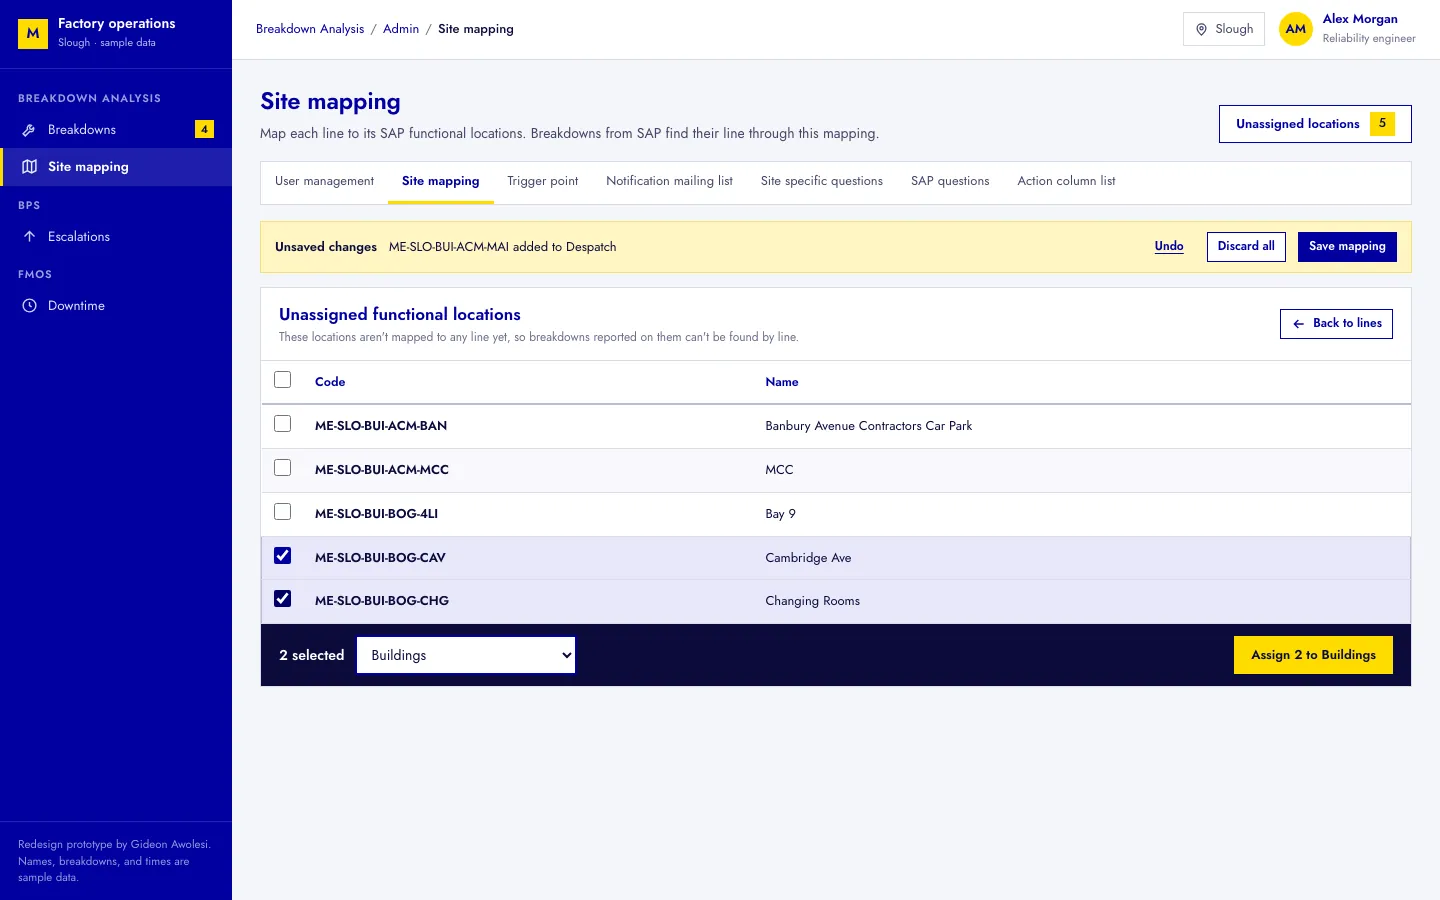
Unassigned locations: A separate list has the functional locations that aren't mapped to any line. You select several, choose a line, and assign them in one step. In the old flow, mapping ten locations to one line meant a modal, a selection, an arrow, and two saves. In the redesign, it's one click on the line and one tick for each location.
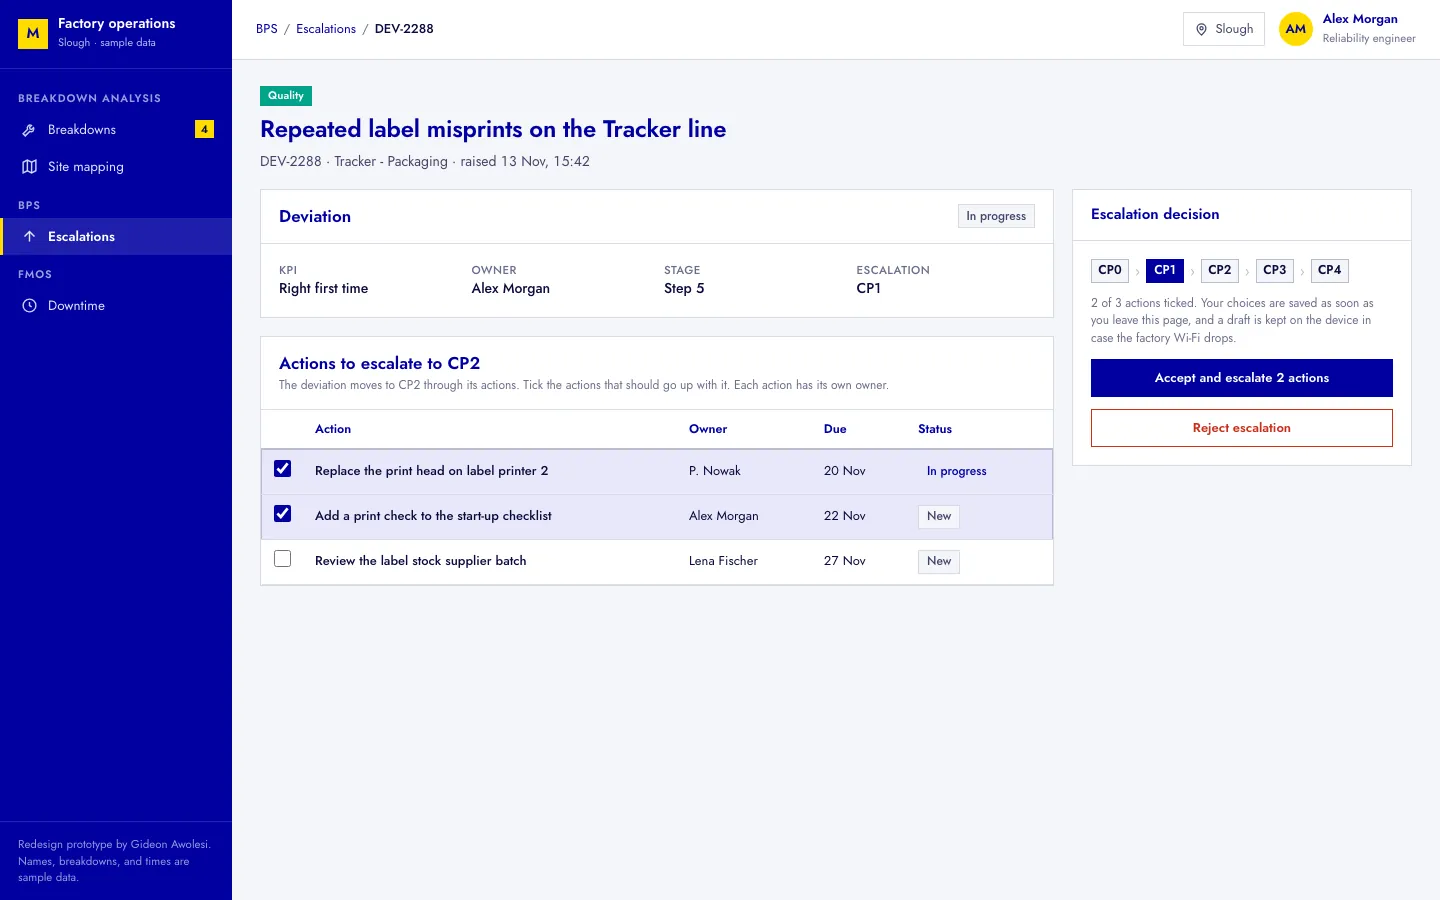
BPS escalation: In BPS, a deviation is escalated through its actions. The decision panel lists the actions with a tick box each, and accepting carries the ticked actions up to the next CP level. A rejection needs a reason. The factory Wi-Fi is weak, so choices are saved when you leave the page, and a draft is kept on the device in the meantime.
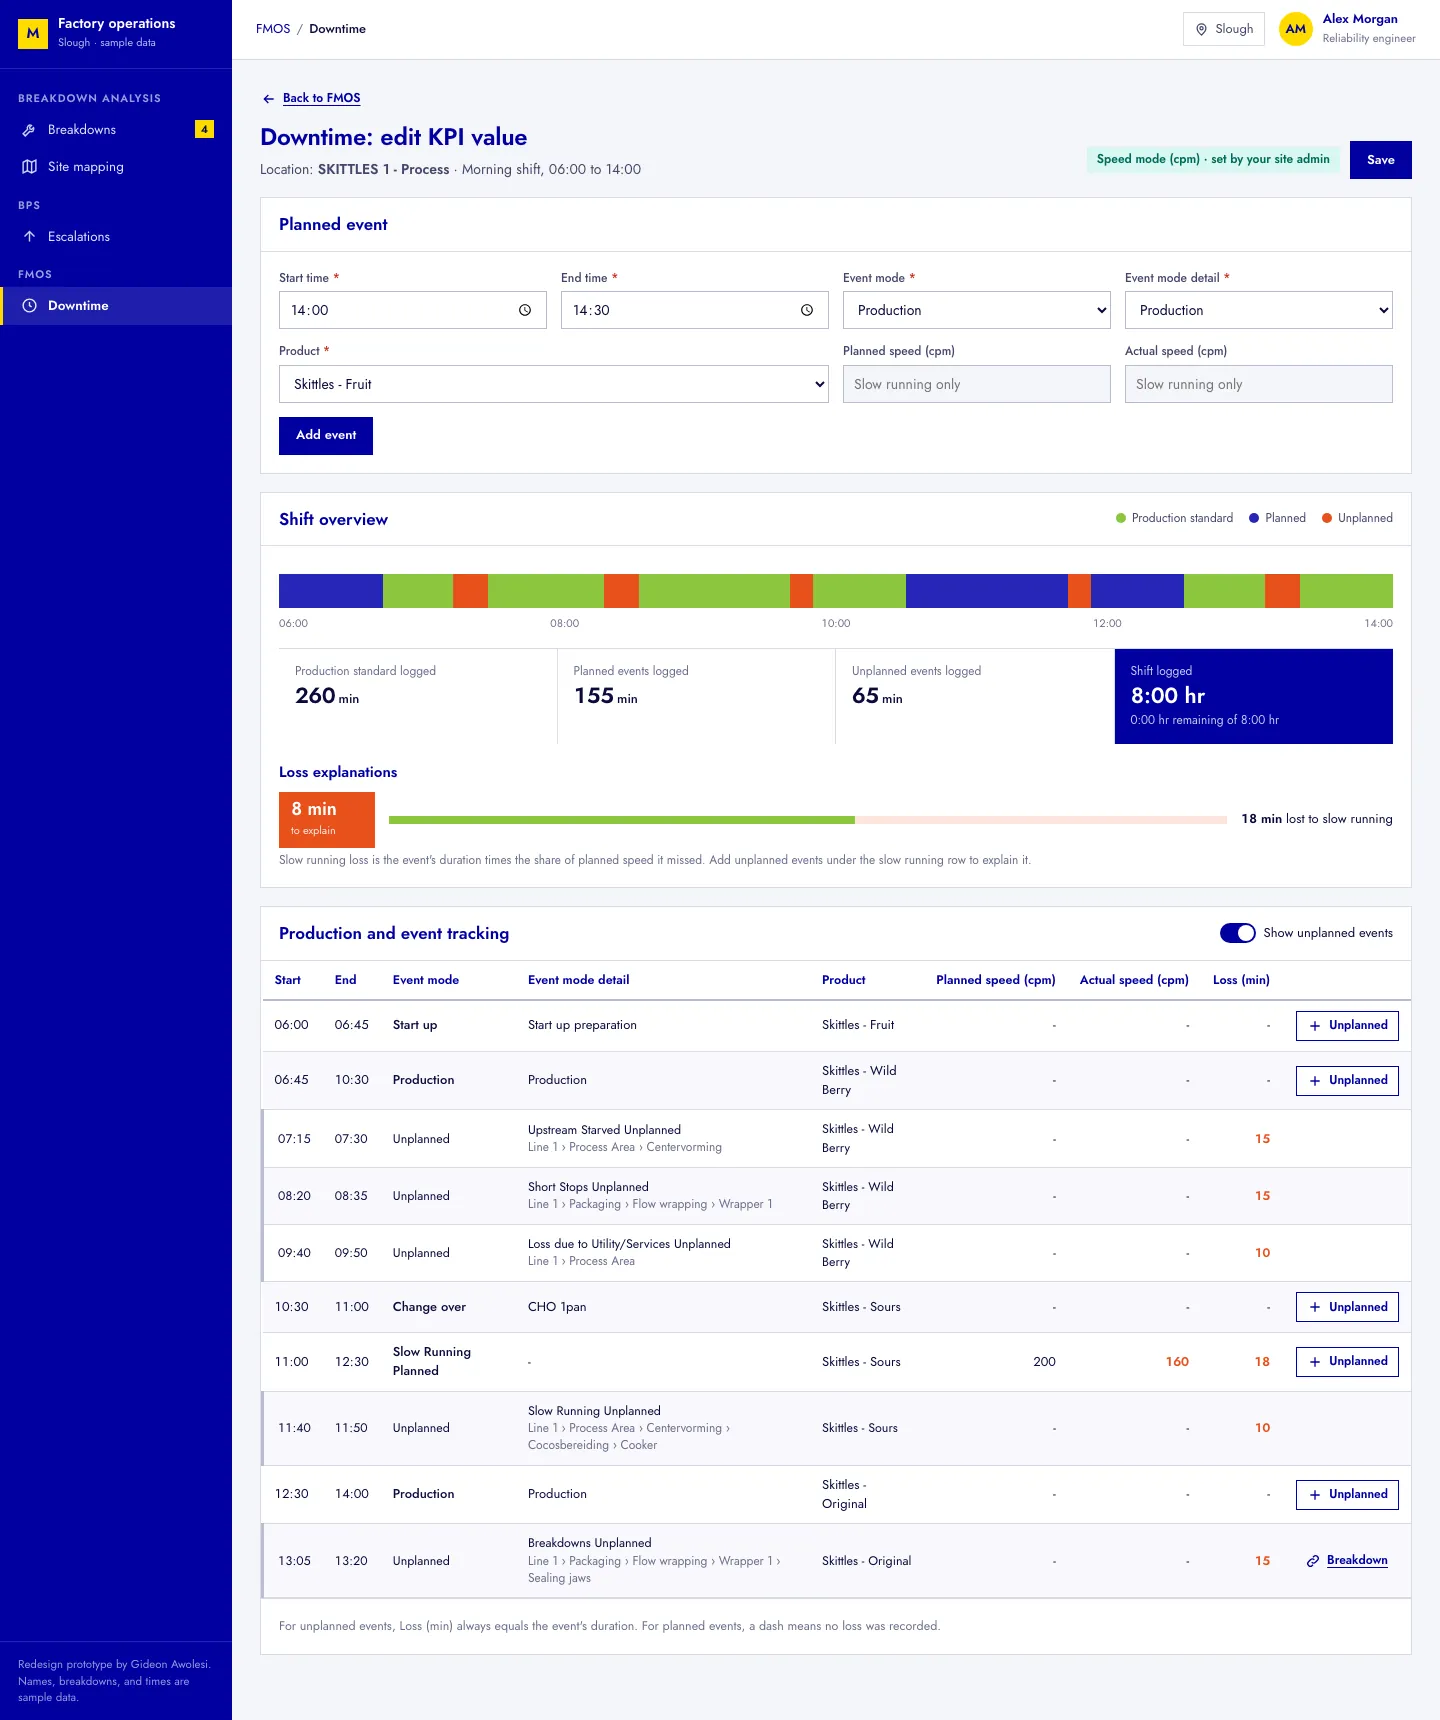
Downtime: A badge at the top marks the site as speed mode, set by the site admin. Speed fields only open for Slow Running Planned. The shift visualisation and the minutes summary are now one panel, as the team agreed, and the loss explanations count the minutes lost to slow running that are still unexplained. In the original screens, a few totals didn't match the rows, like 120 minutes in the table against 95 in the summary. In the prototype, every total is calculated from the rows.
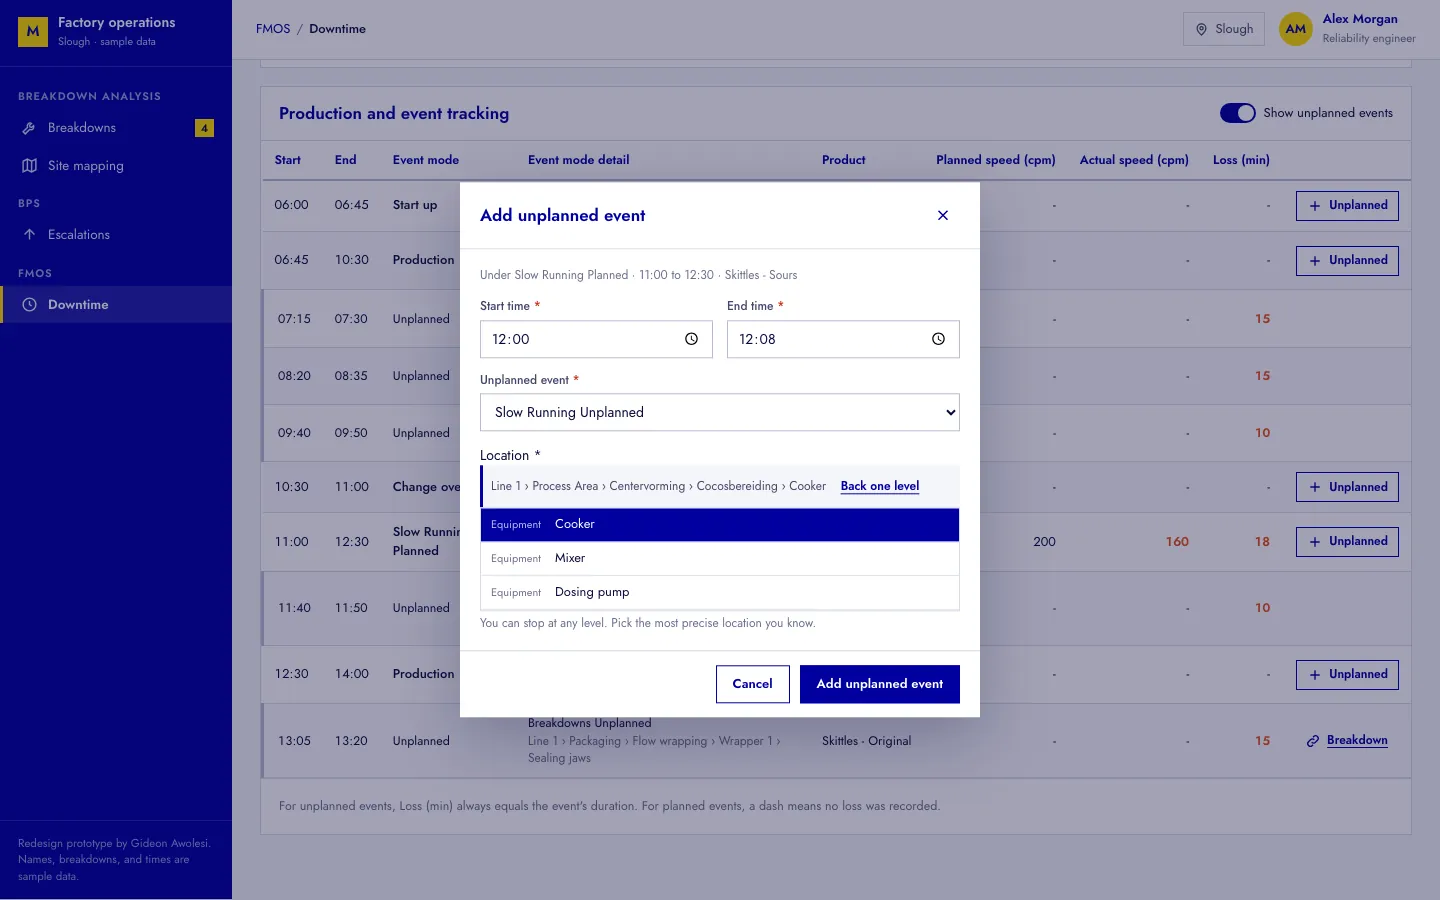
Unplanned events: You add them under the planned event they happened in, and the location picker goes down five levels, from the line to the equipment, and you can stop at any level. An unplanned breakdown links to Breakdown Analysis.
08
Impact
Breakdown Analysis is expected to save Mars at least €86 million a year.
The product owner approved our Breakdown Analysis prototype for testing with the European sites from January 2026, and a developer confirmed that the designs could be built on BPS and the Mars design system. Our design work was tracked as stories on the team's sprint board, like the KPI target settings and the area of responsibility pages.
The 2026 coded prototype is our own redesign. Mars didn't commission it, and it runs on sample data built on the real Slough lines, functional locations, and event categories.